
Design the levels on graph paper
Detailed description
a. LDs- create level flow chart
We actually never did this on TTT. But we did do it on Indiana Jones and the Infernal Machine, and it was very helpful and I wish we had done it on TTT. It is basically a level flow chart done on paper to give everyone and idea of the basic progression of the level.
Here is Rohan 1 from The Two Towers. It is a good example of what a flow chart should look like.
Figure 1
This is so basic but clear that at this point a lot of good ideas can be added to it. This leaves a lot of room for creativity. A lot of people can contribute at this point, but the Level Designer, client (publisher), producer, and art director should be involved. Which leads to-
b. GD, LD and AD- discuss level content in meeting
So now that the basic game play and theme of this level is establishes the team leaders can all join in and start brain storming ideas to flesh out the level. A story board artist or concept artist should be in the room to rough out ideas so everyone gets a clear picture of some of the more complicated ideas. The ideas that are agreed upon should be written down and added to the Game Design Document. A CA and AD create preliminary color and design sketches to inspire the LDs, EAs and to show the client. The Concept Artist should then pick a few of the most dramatic areas and starts to come up with cool settings for them. The Level Designer should then incorporate these concepts when he starts to draw the final level map. They can also be used to show the publisher what the team is
d. LDs-draw out level on graph paperNow the level designer has all the input he needs and spend the next three days drawing out a detailed map of the level on graph paper that is accurate to the foot. He places on paper with pencil all the level elevations, enemies and interactive objects. He can also place roughly where he thinks the cameras should go and how they should work. This is also where he can layout where the portals and sectors too, though this will obviously change quite a bit. At least it can be roughly placed so the Environment Artists knows where they should be.
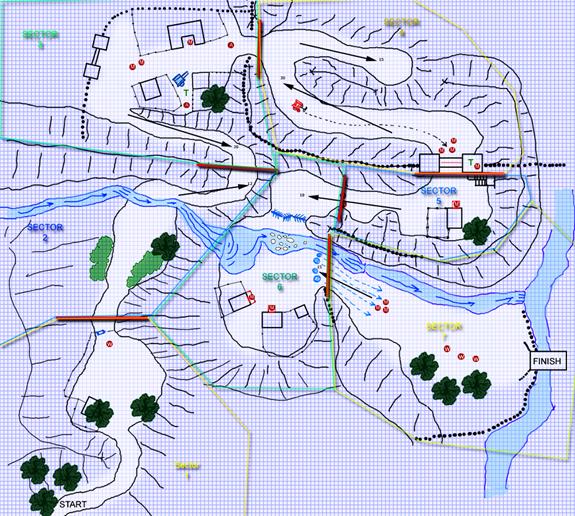
Figure 2
The red circles are enemies. The red lines are the portals. The colored lines are the sector boundaries. The top of the arrows indicates the height of an elevation. Blue objects are breakable or interactive objects. The Green T indicates treasure or power ups. The dark green shapes are trees and the light green areas are bushes. The white area is the walk able area, and the black line around them is the collision geometry. The blue areas are, of course, water.

